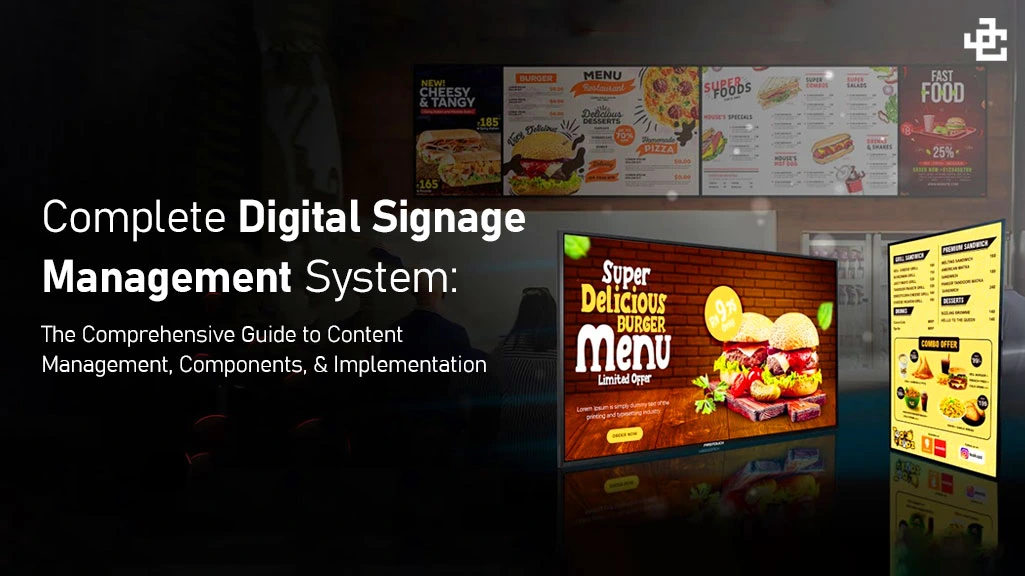
Introduction
Businesses are ditching static printed signage faster than ever. The shift to dynamic, remotely controlled digital displays isn’t just trendy anymore. It’s becoming standard infrastructure for companies that want to stay competitive.
Think about it: a complete digital signage management system brings together hardware, software, and strategic content delivery into one platform. Organizations can now communicate with precision, scale their messaging instantly, and adjust everything in real time.
Retail chains manage promotions across hundreds of stores from one dashboard. Hospitals communicate patient information as situations change. Corporate offices keep employees informed without printing a single memo. This technology has moved from nice to have to mission critical.
This guide synthesizes what’s actually working in the industry right now. We’ve looked at what separates good systems from mediocre ones, how to evaluate vendors without getting buried in sales pitches, and what implementation actually looks like when you get past the marketing materials.
Whether you’re a CTO evaluating platforms, an IT professional managing rollout, or a business leader trying to understand ROI, you’ll find practical answers here. No fluff, just what you need to make informed decisions about digital signage systems in 2025.
What is a Complete Digital Signage Management System?
Definition
A complete digital signage management system lets organizations create, schedule, deploy, monitor, and optimize multimedia content across digital screens from one central location. You’re not dealing with static signs anymore.
This combines hardware like displays and media players with software platforms that deliver dynamic, responsive communication tailored to specific audiences and timeframes.
Core Definition: Think of a digital signage management system as a computer application that handles customization, scheduling, monitoring, and deployment of content across networked displays through centralized control and remote management.
Evolution of Digital Signage
The journey from manual updates to cloud based management changed how businesses communicate:
- Pre Digital Era: Companies relied on printed signs, flyers, and billboards. This meant physical production, delivery trucks, and someone installing everything by hand at each location.
- Early Digital Phase: USB drives became the standard. Someone still had to visit each screen, plug in the drive, load content manually. Better than printing, but still labor intensive.
- Current Era: Cloud platforms now enable instant, synchronized updates across unlimited displays worldwide. Update content in Dubai while sitting in your New York office. That’s the power shift we’re talking about.
This evolution transformed digital signage from luxury amenity into essential business infrastructure. Companies that don’t adapt are visibly behind their competitors.
Core Four Pillars of Digital Signage Systems
Pillar 1: Centralized Content Management (Library Management)
Purpose: This is your creative and organizational backbone.
Key Functions:
- Content creation happens through drag and drop editors with professional templates already built in. No design degree required.
- Organization of multimedia assets covers images, videos, text, animations, and interactive elements all in one library.
- Customization of content layouts and zones adapts to different display types and orientations.
- Integration with live data sources pulls from weather APIs, RSS feeds, social media, inventory systems, and POS terminals automatically.
- Advanced scheduling capabilities let you deploy content based on time, location, and specific audience segments.
- Template libraries enable rapid content creation. Your marketing team can build professional displays in minutes, not hours.
Operational Impact: Companies that centralize content control eliminate the need for on site staff managing individual displays. This cuts operational costs by 40 to 60% compared to manual updates. That’s real money back in your budget.
Keywords: Content creation tools, digital signage templates, multimedia asset management, scheduling software, live data integration
Pillar 2: Powerful Screen Control (Efficient Remote Screen Management)
Purpose: Real time operational control over physical display devices, no matter where they’re located.
Key Capabilities:
- Remote command execution means you can restart applications, clear cache, and reboot displays from anywhere.
- Auto start and auto recovery features keep displays running continuously without manual intervention.
- Live screenshot capture lets you verify playback without sending someone to physically check the screen.
- Kiosk mode activation locks displays into single purpose applications, preventing user interference.
- Brightness and dimmer settings adjust automatically or manually based on ambient lighting conditions.
- Device health monitoring tracks disk space, memory usage, temperature, and network status proactively.
- Automated fault detection sends instant alert notifications before small problems become big failures.
Business Value: Companies using these systems reduce mean time to repair by 70% through proactive monitoring. You stop paying technicians to make unnecessary site visits just to check if something’s working.
Keywords: Remote device management, screen control software, digital display monitoring, automated alerts
Pillar 3: Team Access Management (Seamless Collaboration)
Purpose: Organizational structure and access control for environments where multiple people need different permission levels.
Role Hierarchy:
- Super Admin: Gets system wide permissions, creates user accounts, and approves new administrators.
- Admin (Location Manager): Manages screens, delegates technicians, schedules content, and monitors alerts.
- Technician (Field Staff): Handles installation and maintenance with limited permissions, usually through mobile apps.
Governance Features:
- Role based access controls prevent unauthorized modifications that could damage your brand.
- Hierarchical screen grouping organizes displays by geography, department, or audience type.
- Maker and checker approval systems require sign off before content goes live to critical displays.
- Activity logging tracks every user action for compliance and accountability.
- Multi user simultaneous access with conflict resolution prevents scheduling collisions.
Organizational Benefit: Large enterprises can delegate securely while maintaining brand consistency and meeting regulatory compliance requirements. Marketing in Singapore and operations in Texas can work simultaneously without stepping on each other’s toes.
Keywords: Role based access control, multi user management, approval workflows, team collaboration
Pillar 4: Analytics, Security & Reporting (Data Driven Insights)
Purpose: Performance measurement, accountability, and network protection that actually tells you if your investment is working.
Key Components:
Proof of Play Reporting: Verifies that scheduled content actually displayed on intended screens at the right times. Essential for advertising accountability and vendor payments.
Audit Logs: Complete activity history showing who accessed the system, when they logged in, and what changes they made.
Network Uptime Monitoring: Tracks display connectivity and availability rates so you know your system reliability.
Performance Analytics: Measures content engagement, audience dwell time, and conversion metrics tied to business outcomes.
Security Features: Two factor authentication, SSL encryption, end to end data encryption, and 24/7 network monitoring protect your content and network.
Custom Dashboards: Executive level reporting on campaign effectiveness and ROI that board members actually understand.
Business Intelligence: Organizations using analytics report 35 to 45% improvement in content performance through data driven optimization. You stop guessing what works and start knowing.
Keywords: Digital signage analytics, proof of play, audit logs, performance metrics, content engagement
Essential Components: Hardware and Software
Hardware Architecture
Display Types and Specifications
LCD (Liquid Crystal Display)
Most retail and corporate environments use LCD displays indoors. They’re energy efficient with excellent color accuracy that makes products look good.
- Available sizes range from 32 inches up to 98 inches and beyond
- Resolution reaches 4K Ultra HD for detailed product visualization
- Operating temperature typically runs from negative 10°C to 40°C, covering most indoor environments
- Typical lifespan hits 30,000 to 60,000 hours before brightness degrades noticeably
LED (Light Emitting Diode)
Superior brightness makes LED perfect for high ambient light environments and outdoor signage.
- Video walls often use LED because of modular construction allowing custom sizes
- Energy consumption runs higher than LCD, requiring efficient power management systems
- Excellent durability handles harsh weather conditions that would kill other display types
OLED (Organic Light Emitting Diode)
Premium image quality with perfect blacks and contrast ratios impresses in high end retail and hospitality.
- Growing adoption continues as prices drop, though still more expensive than LCD/LED alternatives
- Lower brightness than LED makes OLED better suited for indoor use with controlled lighting
- Technology keeps improving with better specifications emerging every year
Projection Systems
Rear or front projection works for specialized applications like immersive experiences.
- Creating video wall experiences with projection requires careful planning but delivers impact
- Regular maintenance and bulb replacement add to ongoing costs
- Effective for large format displays in theaters, museums, and public spaces where traditional screens won’t work
Interactive Touchscreen Displays
Capacitive touch technology provides responsive interaction that customers expect from their smartphones.
- Multi touch gestures and advanced applications expand what’s possible beyond simple navigation
- Integration with payment processors, barcode scanners, and biometric readers turns displays into transaction terminals
- Kiosks, wayfinding systems, and self service applications depend on reliable touch technology
Media Players (Signage Players)
Media players serve as the computing engine retrieving content from the CMS and rendering it on displays. Think of them as the brain behind the screen.
Types:
Built in Media Players (Integrated)
- Media player integrated directly into the display device simplifies installation dramatically
- Fewer cables and components mean less that can go wrong during installation
- System complexity drops, reducing potential failure points
- Upgrade flexibility gets limited compared to standalone players, but for many deployments this tradeoff makes sense
Standalone Media Players (Dedicated Hardware)
- Separate computing devices connect to displays via HDMI or DisplayPort connections
- Greater processing power handles complex content and multiple simultaneous streams
- Easier to upgrade and repair without replacing expensive displays
- Advanced features like dual output for controlling multiple screens become possible
Specifications to Consider:
- Processing power through CPU/GPU capabilities determines what content you can display smoothly
- RAM minimum starts at 2GB, but 4GB or more handles complex content better
- Storage capacity should use SSD for reliability over traditional hard drives
- Connectivity options include Ethernet, Wi Fi, and 4G/5G cellular for different deployment scenarios
- Supported media formats like H.264, H.265, MP4, WEBM, and HTML5 affect content flexibility
- Update mechanisms using OTA (over the air) updates keep systems current without site visits
Network and Connectivity Infrastructure
Wired Connectivity
- Ethernet using Cat5e, Cat6, or Cat6A provides the most reliable connection for mission critical deployments
- Typical bandwidth ranges from 100 Mbps to 10 Gbps depending on infrastructure investment
- Permanent installations in venues with existing infrastructure work best with wired connections
Wireless Connectivity
- Wi Fi using 802.11ac or 802.11ax standards works for most installations today
- Typical bandwidth hits 50 to 300 Mbps depending on network congestion and distance from access points
- Locations where running cables is impractical or expensive benefit from wireless flexibility
Cellular Connectivity (4G LTE/5G)
- Remote or outdoor locations without Wi Fi infrastructure depend on cellular connections
- Redundancy for mission critical applications provides backup when primary connections fail
- Higher latency and data costs compared to wired or Wi Fi make this the fallback option
Network Architecture Best Practices:
- Dedicated VLAN (virtual local area network) isolates signage systems from other network traffic
- Quality of Service (QoS) prioritization ensures display updates don’t compete for bandwidth with other applications
- Redundant connectivity for high availability deployments prevents single points of failure
- Regular bandwidth monitoring and capacity planning prevent performance degradation as networks grow
Mounting Hardware and Environmental Considerations
Mount Types:
- Fixed wall mounts work for permanent installations where displays won’t move
- VESA compatible mounts provide flexible positioning options with standardized mounting patterns
- Video wall mounts handle tiled multi display arrangements with precise alignment
- Free standing pedestal mounts enable temporary or mobile setups for events and changing spaces
- Outdoor weatherproof enclosures protect displays from elements in external installations
Environmental Factors:
- Temperature control matters. Indoor HVAC systems usually suffice, but outdoor installations need temperature regulated enclosures.
- Humidity management becomes critical for outdoor coastal installations where salt air accelerates corrosion.
- Ventilation ensures adequate airflow preventing component overheating that shortens lifespan.
- Ambient lighting considerations include direct sunlight requiring high brightness displays or anti glare filters.
- Vandalism protection through polycarbonate shields and lockable enclosures protects investments in high risk locations.
Software Architecture
Core Software Components
Content Management System (CMS): The Command Center
The CMS represents the operational core of your entire digital signage system. This interface is where administrators, content creators, and technicians interact with the network daily.
Deployment Models:
Cloud Based (SaaS: Software as a Service)
Hosted on vendor servers, you access everything through web browsers or mobile apps.
Advantages: Remote accessibility from anywhere, automatic updates you don’t manage, minimal IT infrastructure investment required.
Disadvantages: Internet connectivity dependence, recurring subscription costs that add up over time.
Best for: Multi location enterprises and organizations lacking dedicated IT resources.
Examples: Scala, Spectrio, Hype Loop, Enplug dominate this space.
On Premises (Self Hosted)
Software gets installed on your company owned servers under your direct control.
Advantages: Complete data control, one time licensing costs, independence from vendor infrastructure and decisions.
Disadvantages: IT maintenance burden falls on your team, infrastructure costs upfront, manual updates required.
Best for: Highly regulated industries like healthcare and finance, organizations with strong IT expertise.
Examples: Some enterprise Scala installations, custom deployments for specific needs.
Hybrid Solutions
- Local caching with cloud synchronization combines strengths of both approaches
- Recommended for organizations with spotty connectivity or ultra high reliability requirements
- Content stays accessible even when internet connections fail temporarily
Content Distribution Network (CDN)
Organizations managing global display networks need CDN infrastructure:
- Geographically distributed servers deliver content faster by serving from locations near displays
- Latency reduction between content scheduling and actual display matters for time sensitive content
- Bandwidth optimization through edge caching reduces network costs significantly
- Critical for international retail chains, airport systems, and transportation networks spanning continents
Digital Signage Content Management System (CMS) Explained
What is a Digital Signage CMS?
A Digital Signage Content Management System is specialized software addressing unique needs of managing content across physical display networks. Unlike WordPress or Drupal built for websites, digital signage platforms incorporate display specific features including hardware management, real time scheduling, and venue specific deployment.
Key Differentiation from Web CMSs:
- Designed for visual first content with minimal text, making images and video the primary focus
- Hardware state management tracks power status, connectivity, and playback status of physical devices
- Real time content updates happen instantly with no page refresh required like websites
- Venue and location based delivery rules target content to specific physical spaces
- Proof of play verification and compliance reporting prove content actually displayed as scheduled
Core CMS Functionalities
1. Intuitive Content Creation Interface
User Experience Design:
- Drag and drop editors eliminate technical barriers. Marketing teams create content without calling IT every time.
- WYSIWYG (What You See Is What You Get) preview matches actual display output, eliminating surprises when content goes live.
- Pre built template library with industry specific designs gets new users productive immediately.
- Onboarding time for industry leaders takes less than 1 hour of training before users accomplish real tasks.
Content Format Support:
- Static images including JPG, PNG, GIF, and WEBP formats cover most visual needs
- Video formats like MP4, MOV, WEBM, and MPEG play smoothly across different hardware
- Dynamic content through HTML5 and CSS animations adds movement and engagement
- Third party widgets pull weather, social media feeds, and news tickers automatically
- Real time data feeds connect to inventory, pricing, and schedule systems for always current information
2. Advanced Scheduling Engine
Temporal Scheduling:
- Dayparting shows different content for morning, afternoon, evening, and night periods automatically
- Day of week rules separate weekday from weekend content without manual intervention
- Date based campaigns handle holiday specials and seasonal promotions with start and end dates
- Time zone handling works across geographically distributed networks without confusion
- Recurring schedules automate weekly or monthly patterns, eliminating repetitive manual scheduling
Location Based Deployment:
- Screen grouping hierarchies organize from region down to location down to individual screen
- Location specific overrides customize content while maintaining global defaults for brand consistency
- Audience segment targeting considers demographic data, purchase history, and behavior patterns
- Real time schedule adjustments respond to business events as they happen
Practical Example: A retail chain schedules a company wide Monday Morning Message from 6:00 AM to 9:00 AM across all stores. Local store specials automatically override during peak hours. Evening entertainment content takes over after 6 PM. All managed from one interface without touching individual stores.
3. Multi Location and Multi User Management
Hierarchical Access Control:
- Super Admin configures systems, provisions users, and approves campaigns at the highest level
- Regional Managers control content specific to their geographic regions within corporate guidelines
- Store Managers make local content overrides without breaking brand standards
- Content Creators work within designated screen groups without system configuration access
- Technicians maintain displays and run diagnostics without touching content
Organizational Structures:
- Unlimited user accounts scale across all organizational levels from headquarters to field locations
- Delegated authority lets managers grant limited permissions to their direct reports
- Activity audit trails provide complete accountability for compliance and troubleshooting
- Approval workflows prevent unauthorized content deployment that could damage brand reputation
4. Real Time Monitoring and Diagnostics
Network Health Dashboard:
- Live status shows every connected display as online, offline, or error state instantly
- Connectivity metrics track signal strength, bandwidth usage, and latency for performance optimization
- Hardware utilization monitors CPU, memory, disk space, and temperature before problems occur
- Content playback verification confirms what’s currently displaying on each screen remotely
- Historical uptime reporting documents SLA compliance for vendor accountability
Alert System:
- Automatic notifications fire when displays go offline unexpectedly
- Threshold based alerts warn about low disk space or high temperature before failures
- Escalation workflows notify technicians first, then managers if issues remain unresolved
- Integration with ticketing systems creates automatic work orders for tracking and resolution
5. Analytics and Performance Measurement
Proof of Play Reporting:
- Verification proves scheduled content actually displayed on target screens at specified times
- Timestamp based playback logs document exactly when content appeared
- Exception reporting highlights content that failed to display with reasons why
- Essential for advertising ROI measurement and vendor accountability in managed networks
Engagement Metrics (Advanced Systems):
- Dwell time measures how long viewers actually look at displays, not just pass by
- Impressions calculate based on traffic patterns and typical viewing behavior
- Conversion tracking ties sales to specific content displayed at purchase times
- A/B testing results compare different content versions with statistical significance
Reporting Capabilities:
- Pre built dashboards cover common metrics most organizations care about
- Custom report builders create specific reports for unique business requirements
- Scheduled automated report distribution emails insights to stakeholders regularly
- Executive summaries translate technical metrics into business impact for board presentations
Top Features to Look for in a Digital Signage CMS
When evaluating digital signage platforms, prioritize these seven critical features that separate enterprise solutions from consumer grade systems:
1. User Friendly Interface and Intuitive Design
Evaluation Criteria:
- Onboarding time should require less than 1 hour to accomplish basic tasks like creating and scheduling content
- Dashboard organization uses logical grouping of related functions so users find features quickly
- Navigation provides clear hierarchy enabling users to find features without hunting through menus
- Mobile responsiveness lets you manage content from smartphones and tablets, not just desktop computers
- Help documentation includes comprehensive guides, video tutorials, and in app assistance when stuck
Red Flags:
- Requiring more than 10 hours of training signals overly complex systems your team will struggle with
- Cluttered interface with more than 5 levels of menu nesting frustrates users and slows productivity
- Inconsistent terminology or design patterns indicates poor product development and testing
2. Robust Remote Management Capabilities
Essential Capabilities:
- Instant content push to selected screens happens with no delay and no manual refresh required
- Real time schedule adjustments reflect immediately across your entire network
- Remote device control includes restart, reboot, and brightness adjustment without site visits
- Mobile app enables management from field locations during installations or troubleshooting
- Works across different network conditions including Wi Fi, cellular, and wired connections reliably
Performance Standards:
- Content update propagation should take less than 30 seconds to reach all screens
- Remote command execution completes in less than 10 seconds for immediate response
- Mobile app responsiveness matches desktop functionality with optimized interfaces for smaller screens
3. Advanced Scheduling and Content Prioritization
Key Requirements:
- Granular scheduling works by minute, not just by day for precise timing control
- Multiple simultaneous campaigns with conflict resolution prevent scheduling collisions automatically
- Ad prioritization ensures high value content displays more frequently than filler
- Shuffle versus sequential playback modes vary content presentation patterns
- Blackout periods prevent content display during specified times like overnight maintenance
- Integration with business calendars and event management systems synchronizes with company activities
Use Case Validation: Your system should handle scenarios like: Display promotion A at 2x frequency during Tuesday through Thursday lunch hours, replace with promotion B during weekends, but pause both for system maintenance from 2 AM to 3 AM daily.
4. Multi Screen and Multi Location Support
Scalability Requirements:
- Manage unlimited screens from single dashboard without performance degradation
- Group screens by geographic location, department, audience type, or custom criteria that match your organization
- Set different content for different screen groups simultaneously without confusion
- Location specific overrides work without affecting global defaults across the network
- Template propagation updates 100 screens with 3 clicks instead of 100 individual updates
Geographic Scope Support:
- Single location deployments handle one building with multiple screens efficiently
- Multi location chains manage 10 to 50 locations typical for retail and restaurant brands
- Enterprise networks scale to 100+ locations globally for corporate and franchise operations
- Hybrid approaches combine internally managed displays with third party placement networks
5. Real Time Analytics and Performance Tracking
Core Analytics Metrics:
- Proof of Play confirms content displayed exactly as scheduled for accountability
- Impressions estimate audience size based on traffic patterns and typical dwell time
- Engagement measures interaction metrics for touch enabled displays and kiosks
- Content Performance identifies which specific content drives desired actions like purchases or inquiries
- Network Health tracks uptime percentage and identifies common failure patterns
Business Intelligence Applications:
- A/B testing compares different content versions to optimize effectiveness statistically
- ROI calculation on digital signage investments proves business value to finance teams
- Seasonal trend analysis informs content strategy for upcoming campaigns
- Audience insights guide creative development based on what actually works
6. Scalability and Third Party Integration
Scalability Dimensions:
- User accounts support from individual departments to entire enterprises with 1 to 10,000+ users
- Displays add without architectural redesign as your network grows organically
- Geographic scope expands from single buildings to global networks seamlessly
- Content volume handles from dozens to millions of assets without performance issues
- Usage patterns accommodate peak traffic periods like holiday campaigns without degradation
Integration Ecosystems:
- Business Systems connect to POS (point of sale), CRM, inventory management, and HR systems
- Data Sources pull from weather APIs, news feeds, social media, and live sports scores automatically
- Creative Tools integrate with Adobe Creative Suite, Canva, and other design software
- Infrastructure connects to CDN providers, video hosting platforms, and cloud storage services
- APIs provide RESTful interfaces enabling custom integrations your developers can build
7. Cost Effectiveness and ROI Potential
Pricing Models:
- Per screen licensing provides predictable costs scaling linearly with network size
- Enterprise licensing offers fixed costs for unlimited screens, better economics for large deployments
- Usage based pricing varies costs by bandwidth, storage, or transactions for flexible budgeting
- Freemium models provide basic features free with premium features paid, though rare in enterprise space
ROI Consideration:
- Revenue opportunities include ad placements and sponsored content generating income
- Cost avoidance eliminates printing costs and reduces manual update labor
- Efficiency gains reallocate staff to higher value tasks than changing signs
- Sales lift from improved customer engagement directly impacts revenue
Evaluation Framework: Calculate 3 to 5 year TCO (total cost of ownership) including software licensing, hardware maintenance, network connectivity, content creation staff time, and ongoing support services before making decisions.
How Digital Signage Systems Work: The Workflow
Content Creation and Scheduling Workflow
Step 1: Content Design
- Marketer or designer creates visual content using CMS templates or external design tools
- Content uploads to the digital signage CMS platform through web interface or API
- System validates file formats, resolution, and playback compatibility automatically
- Content stores in the media library with descriptive metadata for easy finding later
Step 2: Content Organization
- Content gets tagged by campaign, product category, location, or audience segment
- Version control enables tracking of content iterations over time
- Approval workflows route content to designated reviewers if enabled in your organization
- Approved content moves to ready for scheduling status, available for deployment
Step 3: Scheduling and Deployment Rules
- Content creator specifies which screens or locations should display the content
- Scheduling defines when content should play including date range, time of day, and duration
- Priority level sets relative importance compared to other scheduled content
- Frequency determines how often content appears, like 3 times per hour for high priority items
- System validates scheduling for conflicts and gaps, warning about potential issues
- Schedule gets confirmed and published to the CMS for execution
Step 4: Distribution to Media Players
- CMS generates a playlist containing all scheduled content for each specific media player
- Playlist pushes to media players typically on hourly sync cycles, though customizable
- Media players store content locally through caching for reliability when networks fail
- Playback begins according to scheduled times automatically without intervention
Step 5: Playback and Monitoring
- Media player downloads any new content or updated playlists during sync cycles
- Playback occurs on the connected display following the schedule precisely
- CMS continuously monitors playback status remotely without site visits
- If content fails to display, CMS logs the exception and alerts administrators immediately
Step 6: Real Time Updates
- Emergency messaging or promotional changes can override schedules immediately when needed
- Updated content pushes to targeted displays within 30 seconds for urgent situations
- System verifies that displays received and are showing updated content successfully
- Audit logs record all schedule overrides for compliance and troubleshooting later
Technical Data Flow
Content Creator → CMS Database → Media Player → Display Screen
Media players cache content locally for resilience against network failures. If internet drops, displays continue playing cached content without interruption. When connection restores, media players sync with CMS for any missed updates. Users never see gaps in display operation during temporary network issues.
Benefits of Digital Signage Management Systems
Operational Efficiency
Labor Cost Reduction
- Eliminating on site visits to update individual screens saves massive labor hours
- Content updates take minutes instead of hours or days with traditional methods
- Single person manages what previously required field teams visiting locations
- 40 to 60% reduction in operational overhead for multi location deployments adds directly to profit
Process Automation
- Scheduled content changes automatically without human intervention needed
- Real time updates eliminate delay between business decisions and customer facing implementation
- Recurring campaigns run automatically on predetermined schedules year after year
- Human error in content scheduling and deployment drops dramatically with automation
Business Agility
- Flash sales and promotions deploy in minutes, not days or weeks
- Emergency announcements reach all locations simultaneously during crises
- Seasonal content switching gets managed centrally with few clicks
- Rapid response to competitive threats or market opportunities becomes standard practice
Enhanced Customer Engagement
Visual Impact
- Dynamic content captures attention far better than static signs that blend into backgrounds
- High resolution displays showcase product quality and appeal with stunning clarity
- Video and animation engage viewers emotionally in ways static images cannot
- Consistent professional appearance across all locations reinforces brand strength
Real Time Relevance
- Content adapts to time of day automatically, showing breakfast menus morning and dinner menus evening
- Weather aware displays show seasonal promotions matching current conditions outside
- Location specific messaging resonates with local audiences better than generic national campaigns
- Personalization based on viewer characteristics works with advanced systems using cameras and AI
Interactive Experiences
- Touchscreen displays enable self service transactions reducing wait times and staffing needs
- Wayfinding systems help customers navigate facilities independently
- Engagement metrics measure viewer interaction quantitatively for optimization
- Feedback mechanisms collect customer opinions directly through displays
Cost Optimization
Compared to Traditional Static Signage:
- Elimination of printing costs for paper, ink, and materials saves thousands annually
- No physical distribution and installation labor needed for content updates
- No storage requirements for inventory of printed signs cluttering back rooms
- Reduced environmental impact from eliminating paper waste improves sustainability metrics
Infrastructure Efficiency:
- Centralized control reduces staffing requirements across the organization
- Reduced travel time for technicians who fix issues remotely instead of driving
- Prevention of problems through proactive monitoring stops small issues before they become expensive
- Quick resolution through remote diagnostics minimizes downtime costs
Comparative ROI Analysis:
Traditional printed signage for 100 locations costs $10,000 to $20,000 annually for printing plus $30,000 to $50,000 annually for labor updating signs. Total annual cost runs $40,000 to $70,000.
Digital signage system for 100 locations costs $50,000 to $100,000 in year 1 for hardware and software. Years 2 through 5 cost $5,000 to $15,000 annually for software plus $10,000 to $20,000 for reduced labor.
3 year ROI shows 40 to 60% cost reduction versus traditional methods, paying back initial investment quickly.
Brand Consistency and Control
Message Standardization
- All locations display approved corporate messaging without local deviations
- Prevents unauthorized content or off brand materials damaging reputation
- Template system maintains visual consistency automatically across the network
- Approval workflows prevent brand violations before content goes live
Campaign Coordination
- Simultaneous launch of marketing campaigns across all locations creates impact
- Coordinated messaging prevents conflicting promotions confusing customers
- Consistent product positioning and pricing reinforces brand reliability
- Unified brand experience regardless of which location customers visit
Competitive Differentiation
- Modern appearance appeals to younger demographics who expect digital experiences
- Technology investment signals business sophistication to customers and partners
- Memorable experiences create positive brand associations that drive loyalty
- Social media amplification happens when customers share unique signage experiences
Data Driven Decision Making
Content Performance Measurement
- A/B testing different creative approaches identifies what actually works with real customers
- Quantifying impact of specific promotions on sales proves marketing effectiveness
- Understanding which content drives conversions guides creative development
- Optimization based on empirical data beats intuition every time
Business Intelligence
- Traffic pattern analysis informs scheduling decisions for maximum impact
- Peak hour identification guides promotional timing for highest visibility
- Content performance benchmarking across locations identifies best practices
- ROI calculation proves marketing effectiveness to skeptical executives
Compliance and Audit Trail
- Complete history shows what content displayed when and where for regulatory compliance
- Regulatory compliance matters for heavily regulated industries like finance and healthcare
- Dispute resolution capability proves content was or wasn’t shown when questioned
- Accountability for promotional claims protects against legal challenges
Industry Applications and Use Cases
Retail Sector
Quick Service Restaurants (QSRs)
- Digital menu boards display offerings with high quality imagery making food look delicious
- Dayparting strategies automatically show breakfast, lunch, and dinner menus at appropriate times
- Pricing displays coordinate with inventory levels, hiding sold out items automatically
- Promotion rotation maximizes visibility of high margin items throughout the day
- Drive through displays synchronize with order management systems showing current orders
Retail Stores
- Product showcase displays highlight new arrivals immediately when they hit floors
- Wayfinding systems direct customers through stores to departments they’re seeking
- Self checkout kiosks process transactions faster than traditional cashier lanes
- Interactive displays enable product comparison helping customers make informed decisions
- Promotional content rotation based on inventory pushes items that need to move
Hospitality and Food Service
Hotels and Resorts
- Digital lobby displays welcome guests by name with personalized messages
- In room information screens provide services information without printing materials
- Elevator displays advertise hotel amenities capturing captive audiences
- Meeting room booking displays show availability and current reservations
- Digital concierge answers guest inquiries 24/7 without staffing front desk continuously
Restaurants and Cafes
- Digital menu boards change throughout the day automatically without staff intervention
- Nutritional information and allergen displays meet regulatory requirements easily
- Promotional content for specials and new items updates instantly from corporate
- Customer order status displays reduce perceived wait times significantly
- Social media feeds and guest recognition create engagement and loyalty
Corporate and Enterprise
Office Buildings
- Employee engagement displays share company news keeping teams informed and connected
- Meeting room booking systems prevent double bookings and scheduling conflicts
- Sales dashboard displays motivate teams by showing real time performance metrics
- Emergency communication displays reach all employees instantly during crises
- Visitor welcome and wayfinding helps guests navigate buildings independently
Large Facilities and Campuses
- Campus wayfinding guides visitors and new employees to destinations
- Departmental announcements and celebrations recognize achievements publicly
- Emergency alert systems for safety information reach everyone immediately
- Recruitment messaging for hiring initiatives attracts talent visiting facilities
Transportation and Logistics
Airports
- Real-time flight information displays (FIDS systems)
- Gate assignment announcements
- Baggage claim information
- Advertising and duty-free promotions
- Security and safety messaging
Transit Stations (Bus, Train, Metro)
- Real-time schedule displays
- Service alerts and disruption notifications
- Advertising displays generating revenue
- System status and maintenance information
- Emergency messaging capability
Commercial Vehicles
- Fleet management information
- Destination and route displays
- Driver performance feedback
- Safety messaging and alerts
Healthcare Facilities
Hospitals and Clinics
- Patient information and consent forms
- Wayfinding for departments and services
- Wait time displays reducing perceived delays
- Health and wellness messaging
- Check-in and registration support
Pharmacies
- Prescription status displays
- Health promotion messaging
- Medication information displays
- Safety alerts and warnings
Education Sector
Schools and Universities
- Student achievement and celebration displays
- Campus announcements and events
- Classroom scheduling displays
- Wayfinding for visitors
- Emergency alert system integration
- Recruitment messaging for prospective students
Library Systems
- Event announcements and programming
- New arrival highlights
- Library hours and service information
- Interactive way finding systems
- Content displays in different departments
Public Sector and Government
Government Buildings
- Service information and hours
- Queue management displays
- Permit status and processing information
- Public announcements and alerts
- Civic engagement and educational messaging
Emergency Services and Utilities
- Public safety information
- Emergency management alerts
- Service outage notifications
- Community meeting information
Cloud-Based vs. On-Premises Solutions
Cloud-Based Digital Signage CMS (SaaS Model)
Characteristics:
- Software hosted on vendor-managed infrastructure
- Accessed via web browser or native mobile application
- Automatic updates and maintenance
- Subscription-based pricing model
Advantages:
- Accessibility: Management from anywhere with internet access
- Low IT Burden: No server maintenance or infrastructure management
- Scalability: Adding screens requires no hardware investment
- Automatic Updates: Latest features and security patches without manual intervention
- Lower Initial Cost: No upfront hardware investment (though recurring subscription)
- Disaster Recovery: Built-in redundancy and backup by vendor
- Global Reach: Inherent support for geographically distributed networks
Disadvantages:
- Recurring Costs: Ongoing subscription fees (typically $10-50/screen/month)
- Connectivity Dependency: System unavailable without reliable internet
- Data Location: Content stored on vendor infrastructure (data sovereignty concerns)
- Vendor Lock-in: Migration to competitors challenging and costly
- Latency: Slight delays possible with poor network conditions
Best Use Cases:
- Small to medium businesses (20-500 screens)
- Multi-location enterprises with limited IT resources
- Organizations prioritizing rapid deployment
- Companies with fluctuating screen requirements
Cloud Provider Examples:
- Scala (both cloud and on-premises)
- Spectrio
- Enplug
- Hype Loop
- PickCell
On-Premises Digital Signage Solutions
Characteristics:
- Software installed on company-owned servers
- Managed entirely by organization’s IT department
- One-time licensing or perpetual ownership
- Potential local caching and offline operation
Advantages:
- Complete Control: Full customization and configuration options
- Data Security: Content remains within company firewall
- No Recurring Costs: One-time licensing cost (typically $2,000-$25,000 per system)
- Regulatory Compliance: Meets strict data residency requirements
- Offline Capability: System functions even without internet connectivity
- No Vendor Dependence: Organization controls upgrade schedules
- Integration: Tight integration with existing IT infrastructure
Disadvantages:
- IT Complexity: Requires dedicated IT resources for maintenance
- Infrastructure Cost: Significant upfront investment in servers and networking
- Scalability Challenges: Adding geographic scope requires infrastructure expansion
- Manual Updates: Requires IT intervention for security patches and upgrades
- Maintenance Burden: Organization responsible for backup, disaster recovery, monitoring
- Longer Deployment: Typically takes weeks to months for implementation
Best Use Cases:
- Large enterprises with IT resources
- Organizations with strict data security requirements
- Government and regulated industries
- Companies with extensive customization needs
- Long-term commitments with high volume (1000+ screens)
On-Premises Solution Examples:
- Some Scala deployments
- Custom enterprise solutions
Hybrid Approach
Characteristics:
- Cloud CMS with local media players caching content
- Combines benefits of both models
- Highest resilience and flexibility
Benefits:
- Cloud accessibility with local redundancy
- Content continues displaying even if cloud unavailable
- Reduced bandwidth requirements through local caching
- Incremental cloud synchronization when connectivity restored
Common Challenges and Best Practices
Challenge 1: Content Overload and Design Quality
Problem: Displays cluttered with too much information or poor-quality design undermine effectiveness and viewer engagement.
Best Practice Solutions:
- Follow the “Rule of Three”: Limit each display to 3 key messages maximum
- Use whitespace intentionally to improve readability
- Design for reading distance: Minimum font size = distance (in feet) ÷ 6
- High-contrast colors improving visibility from distance
- Professional design templates ensuring visual consistency
- Regular content audits removing outdated or irrelevant messaging
Design Principles:
- Hierarchy of information (size, color, position emphasizing key messages)
- Consistent branding (colors, fonts, logos on every screen)
- Visual balance (avoiding cluttered or sparse layouts)
- Animation used judiciously (enhancing rather than distracting)
Challenge 2: Technical Issues and Network Failures
Problem: Display failures, connectivity issues, or content delivery errors resulting in blank or outdated screens.
Best Practice Solutions:
- Implement local content caching allowing displays to function without connectivity
- Redundant network connections (Wi-Fi + cellular + wired options)
- Automated monitoring with immediate alert notifications
- Regular system health checks and preventive maintenance
- Rapid incident response procedures and escalation paths
- Vendor SLAs guaranteeing uptime (99.5% typical)
Resilience Strategy:
- Media players continue displaying cached content if connection drops
- Automatic reconnection and update synchronization
- Fall-back displays showing “System Offline” rather than blank screens
- Remote diagnostics enabling rapid troubleshooting
Challenge 3: Inconsistent Messaging Across Locations
Problem: Different displays showing conflicting or outdated content, undermining brand consistency.
Best Practice Solutions:
- Centralized content approval workflows requiring sign-off before deployment
- Version control preventing accidental use of outdated content
- Template system ensuring consistent formatting and branding
- Maker-and-checker systems (content creator + approver verification)
- Regular content audits confirming displays match scheduled content
- Clear accountability for content management responsibility
Governance Framework:
- Corporate content standards document
- Content ownership assigned by function (marketing, HR, IT)
- Approval authority clearly defined
- Escalation procedures for content disputes
Challenge 4: Data Security and Privacy Concerns
Problem: Digital signage systems can become vulnerabilities if not properly secured, exposing sensitive data or enabling malicious content injection.
Best Practice Solutions:
- End-to-end encryption for all data transmission and storage
- Two-factor authentication for user access
- Role-based access control limiting permissions to necessary functions
- Regular security audits and penetration testing
- Vendor SOC 2 Type II certification (for cloud solutions)
- GDPR and privacy regulation compliance
- Network segmentation isolating signage systems
Security Checklist:
- SSL/TLS encryption for all communications
- Password policies requiring complexity and regular changes
- Activity logging tracking all system changes
- API security preventing unauthorized integrations
- Regular backup and disaster recovery testing
- Incident response plan for security breaches
Challenge 5: Cost Management and ROI Uncertainty
Problem: Difficulty in calculating ROI or controlling ongoing costs for digital signage initiatives.
Best Practice Solutions:
- Clear ROI business case including revenue opportunities and cost avoidance
- Pilot programs testing effectiveness before full rollout
- Performance metrics demonstrating impact on business outcomes
- Cost allocation frameworks assigning expenses to appropriate departments
- Regular ROI reviews enabling optimization of underperforming deployments
- Transparent vendor pricing with no hidden fees
ROI Measurement Framework:
- Revenue impact (increased sales, higher transaction value, reduced shrink)
- Cost savings (eliminated printing, reduced labor, lower maintenance)
- Efficiency gains (faster content updates, reduced IT burden)
- Strategic benefits (improved brand perception, competitive differentiation)
Future Trends in Digital Signage Technology
Artificial Intelligence and Personalization
Current State:
- Basic content scheduling and templating
Near-Future (2025-2027):
- AI-driven personalization based on viewer demographics
- Automated content optimization using engagement metrics
- Predictive analytics forecasting content effectiveness
- Voice-controlled content management
- Chatbot integration for customer inquiries
Advanced Future (2028+):
- Real-time content adaptation based on detected audience emotions
- Autonomous content creation using generative AI
- Predictive inventory management coordinating displays with stock levels
Implications:
- Displays becoming more intelligent and responsive
- Significant reduction in content management labor
- Personalization creating competitive advantage
- Privacy considerations requiring clear data governance
Augmented Reality (AR) Integration
Current State:
- Primarily PC/mobile device applications
Near-Future (2025-2027):
- AR overlays on digital displays
- Interactive experiences using AR glasses or mobile devices
- Product visualization enabling customers to see items in context
- Wayfinding using AR navigation
Example Applications:
- Furniture retailer: AR overlay showing how products look in customer’s home
- Automotive showroom: AR display enabling customer to view car in different colors/configurations
- Fashion retail: AR mirror enabling virtual try-on of clothing
Increased Interactivity
Current State:
- Basic touch interaction on some displays
Near-Future (2025-2027):
- Gesture recognition enabling control without touching
- Voice commands for search and ordering
- Facial recognition for personalized content
- Emotion detection adapting content based on viewer responses
- Mobile integration for seamless phone-to-display interaction
Emerging Technologies:
- Eye-tracking measuring viewer attention and interest
- Motion sensors detecting shopper behavior
- Biometric integration for security and personalization
5G and Enhanced Connectivity
Current State:
- Wi-Fi and 4G LTE deployment
Near-Future (2025-2027):
- 5G enabling high-definition video streaming to displays
- Ultra-low latency enabling real-time interactivity
- Network slicing ensuring priority for mission-critical displays
- IoT sensor integration through 5G networks
Impact:
- Faster content delivery reducing update time to seconds
- Higher-quality video and 4K content ubiquity
- Real-time analytics and audience measurement
- Integration with broader IoT ecosystems
Sustainability and Energy Efficiency
Current Developments:
- LED technology reducing energy consumption 30-50% vs. older displays
- Solar-powered outdoor signage
- Recycling programs for end-of-life displays
Future Trends:
- OLED technology with improved energy efficiency
- Kinetic energy harvesting from foot traffic
- Carbon tracking and reporting
- Sustainable supply chain transparency
Business Drivers:
- ESG (Environmental, Social, Governance) corporate commitments
- Consumer preference for sustainable brands
- Regulatory requirements (EU and others)
- Long-term cost benefits of efficient systems
Edge Computing and Reduced Cloud Dependency
Current State:
- Most processing occurs in cloud with thin media players
Future Direction:
- Intelligent media players handling more processing locally
- Offline operation capability
- Reduced bandwidth requirements through edge analytics
- Hybrid cloud-edge architecture
Benefits:
- Better performance with high-latency connections
- Reduced operational costs
- Enhanced data privacy
- Greater system resilience
Choosing the Right Digital Signage Solution
Assessment Framework
Step 1: Define Business Objectives
Key Questions:
- What business problem are we solving? (brand awareness, sales lift, operational efficiency, customer service)
- What is the target audience? (customers, employees, prospects)
- What geographic scope? (single location, multi-location, global)
- What is the deployment timeline? (immediate, phased, long-term)
- What is the budget range? (capital, operating expenses, timeline)
Alignment Check:
Digital signage is most effective for:
- Real-time information that requires frequent updates
- Visual communication requiring high-impact displays
- Location-based messaging for specific audiences
- Promotional activities driving customer engagement
- Integration with broader marketing strategy
Digital signage is less suitable for:
- One-time or rarely-updated messaging (consider printed signage instead)
- Complex information requiring extended reading time
- Highly technical or regulatory communications
- Extreme budget constraints with very long payback requirements
Step 2: Assess Technical Requirements
Infrastructure Questions:
- What network connectivity exists? (Wi-Fi, cellular, wired options)
- What is the technical expertise of staff? (IT resources available)
- What integration needs exist? (POS, CRM, inventory systems)
- What are the security/compliance requirements? (data residency, encryption, audit trails)
- What is the required uptime/reliability? (99%, 99.5%, 99.9%)
Scale Considerations:
- Current number of displays
- Projected growth over 3-5 years
- Geographic distribution
- Expected peak usage patterns
- Bandwidth requirements
Step 3: Evaluate Vendor Capabilities
Evaluation Criteria:
| Criteria | Cloud-Based | On-Premises | Hybrid |
|---|---|---|---|
| Implementation Time | 2–4 weeks | 8–12 weeks | 4–8 weeks |
| IT Resources Required | Minimal | Significant | Moderate |
| Recurring Costs | $10–$50 per screen/month | Minimal | Medium |
| Customization | Limited | Extensive | Good |
| Data Control | Vendor-hosted | Full control | Split responsibility |
| Geographic Scalability | Excellent | Good | Excellent |
| Offline Capability | Limited | Good | Excellent |
| Updates & Maintenance | Automatic | Manual | Mixed |
Due Diligence Checklist:
- Vendor financial stability and market position
- Existing customer base and case studies
- Free trial or pilot program availability
- Support options (chat, phone, email, dedicated account manager)
- Training resources and documentation
- Roadmap and product direction
- Data security certifications (SOC 2, ISO 27001)
- Disaster recovery and business continuity practices
- Pricing transparency with no hidden fees
- Contract flexibility and exit clauses
Step 4: Run Pilot Programs
Pilot Best Practices:
- Start small (5-10 displays) rather than full rollout
- Test in representative locations matching production environment
- Duration: 4-8 weeks enabling realistic evaluation
- Measure specific KPIs: content update time, system uptime, user satisfaction
- Gather user feedback from multiple stakeholder groups
- Compare performance against baseline or alternative solutions
- Document lessons learned for full implementation
Pilot Success Metrics:
- System uptime >95%
- Content update time <30 minutes from creation to display
- User satisfaction score >4/5 across all user groups
- Positive ROI demonstrated within 6-month pilot timeframe
Step 5: Plan Implementation
Key Components:
- Hardware Procurement: Display selection, media players, networking equipment
- Installation: Physical setup, network configuration, display calibration
- Software Deployment: CMS installation, configuration, customization
- User Training: Administrator, content creator, technician training
- Content Migration: Transfer existing content, design new content
- Testing and Validation: Functionality testing, performance verification
- Go-Live: Phased or big-bang activation approach
Timeline Considerations:
- Cloud-based: 2-4 weeks typical (faster)
- On-premises: 8-12 weeks typical (longer due to infrastructure)
- Hybrid: 4-8 weeks typical
Change Management:
- Stakeholder communication throughout process
- Addressing concerns about disruption or job impact
- Clear ownership and accountability
- Celebration of successful launch
Frequently Asked Questions (FAQs)
General Questions
What's the difference between a digital signage system and a regular TV?
While a TV is primarily designed for entertainment viewing, a digital signage system is optimized for commercial communication. Key differences include:
- Operating Schedule: Signage systems run 18-24 hours continuously; TVs designed for intermittent use
- Content Management: Signage systems include CMS for remote scheduling; TVs typically require manual content change
- Durability: Commercial signage displays built for heavy use with longer life spans
- Integration: Signage systems integrate with business systems; TVs are standalone
- Reliability: Signage systems monitored and maintained; TVs operate until failure
How much does a complete digital signage system cost?
Costs vary widely based on deployment scale and requirements:
Small deployment (5 screens):
- Hardware: $2,500-$5,000
- Software (annual): $500-$2,000
- Total first year: $3,000-$7,000
Mid-market (25 screens):
- Hardware: $10,000-$25,000
- Software (annual): $2,500-$10,000
- Total first year: $12,500-$35,000
Enterprise (100+ screens):
- Hardware: $40,000-$200,000
- Software (annual): $10,000-$50,000+
- Total first year: $50,000-$250,000+
How long does implementation typically take?
Timeline depends on deployment model:
- Cloud-based: 2-4 weeks (faster)
- On-premises: 8-12 weeks
- Enterprise deployments: 3-6 months for large-scale rollouts
What training is required for staff?
Training requirements include:
- Administrators: 4-8 hours for system management, user provisioning
- Content Creators: 2-4 hours for content creation and scheduling
- Technicians: 4-8 hours for hardware installation and diagnostics
- Ongoing: Annual refreshers and update training
Can I start small and expand later?
Yes, most systems are designed for scalability:
- Start with 5-10 screens testing effectiveness
- Expand to additional locations based on pilot results
- Upgrade hardware and software as needs grow
- Cloud-based systems particularly suited for this approach
How should I test and iterate on my MVP after launch?
Use a cycle of launch → measure → collect feedback → iterate, focusing on metrics like activation, retention, and feature usage.
Combine analytics, usability testing, and structured user interviews to decide what to improve, remove, or build next
How can AI and LLMs improve the MVP development process for mobile apps?
AI and LLMs can accelerate user research, generate UX copy, assist with prototyping, and help prioritize features based on patterns in user behavior and feedback.
They also support faster experimentation by suggesting variations, spotting anomalies in metrics, and summarizing qualitative feedback at scale.
What are some high-value ways to use AI inside an MVP mobile app?
High-intent use cases include in-app conversational support, personalized onboarding flows, intelligent recommendations, and natural-language search over app content or user data.
These AI-powered experiences can significantly boost engagement and perceived value even in an otherwise minimal feature set
How do I balance data-driven experimentation with user privacy in an AI-enabled MVP?
Design analytics with privacy by default: collect only what is needed, anonymize sensitive data, and clearly communicate how data is used.
Choose compliant tooling, implement consent management, and ensure any AI or LLM features respect regional data regulations and user expectations.
Technical Questions
What internet speed is required for digital signage?
Minimum requirements:
- Single screen: 1 Mbps sufficient for most content
- Multiple screens: 5-10 Mbps per location
- High-definition video: 10+ Mbps recommended
- Wireless deployment: Account for signal strength and interference
An MVP in mobile app development is the simplest version of an app that includes only the essential features needed to solve the primary user problem and deliver clear value.
It allows teams to launch quickly, validate assumptions with real users, and reduce risk and cost before investing in a full-scale product.
What happens if internet goes down?
Well-designed systems continue operating:
- Cached content continues displaying locally
- Updates sync automatically when connection restored
- No user-visible gap in display operation
- Alerts notify administrators of connectivity issues
Can I integrate my digital signage with other business systems?
Most modern systems offer integrations:
- APIs enabling custom integrations
- Standard integrations with popular platforms (Salesforce, Shopify, etc.)
- Real-time data feeds from POS, inventory, CRM systems
- Discuss integration requirements during vendor evaluation
Content and Strategy Questions
Who should manage content creation?
Typical content ownership:
- Marketing: Product promotions, brand messaging
- HR: Employee communications, recruitment
- Operations: Schedules, safety information, alerts
- IT/Signage Team: System administration, technical oversight
Successful implementations assign clear ownership and accountability.
How often should I update content?
Frequency depends on context:
- Retail: Daily or multiple times daily for promotions
- Corporate: 2-3 times weekly for news and updates
- Transportation: Real-time updates for schedules
- Healthcare: Daily for announcements, real-time for alerts
Stale content undermines credibility; establish regular update schedules.
How can I measure the success of my digital signage?
Key metrics include:
- Business Impact: Sales lift, customer. engagement, inquiries, conversions
- Operational: Content update time, system uptime, user adoption
- Audience: Impressions, dwell time, interaction rates
- ROI: Cost savings + revenue impact vs. system investment